SurveilStar provides very powerful and comprehensive application statistics functions. It can record any application usage and their usage duration, generate statistics and report, provide data for reviewing employees' working efficiency.
Click menu Statistics > Application, then select a computer or a group or entire network, and SurveilStar will analysis all recorded application logs and generate a stastistics immediately. There are three buttons on the upper right corner of data display area.
![]() IT manager can select application statistics modes. Currently there are four modes available. They are By Class, By Name, By Detail and By Group.
IT manager can select application statistics modes. Currently there are four modes available. They are By Class, By Name, By Detail and By Group.
![]() Expand sub classes or computers/users in a group. It's not available to Detail Mode.
Expand sub classes or computers/users in a group. It's not available to Detail Mode.
![]() View all records, top 10 records, top 20 records, or custom display recording numbers.
View all records, top 10 records, top 20 records, or custom display recording numbers.
If you want to generate application statistics by class, you may need to sort the applications into classes according to your need. Click menu Classes Management > Applications to manage your application classes. This function will be also discussed in later chapters of SurveilStar Online Guide.
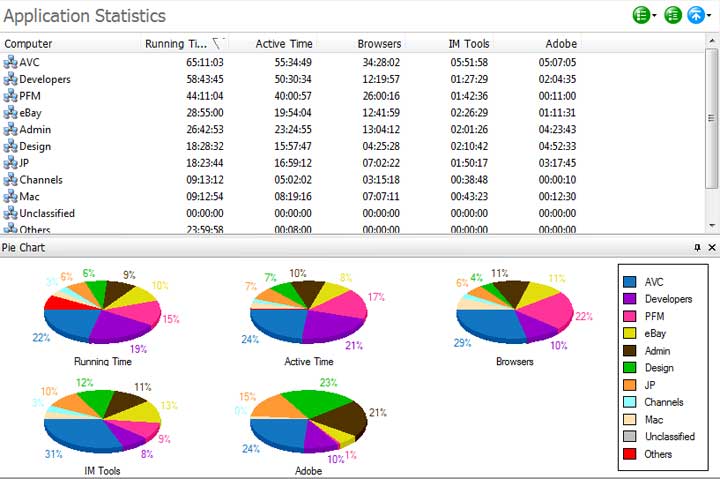
There will be 3 columns which are Class, Time and Percent. By default, both time and percent will be listed in descending order.
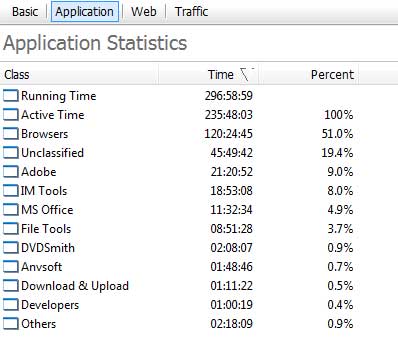
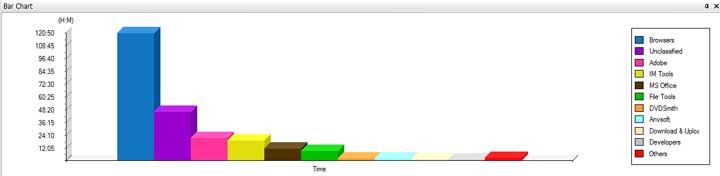
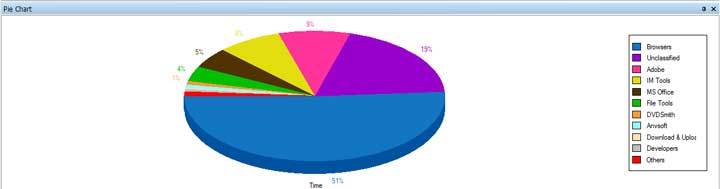
Under the data display area, you will see a chart for the application statistics above. Either Bar Chart or Pie Chart can be used.
Bar Chart
Pie Chart
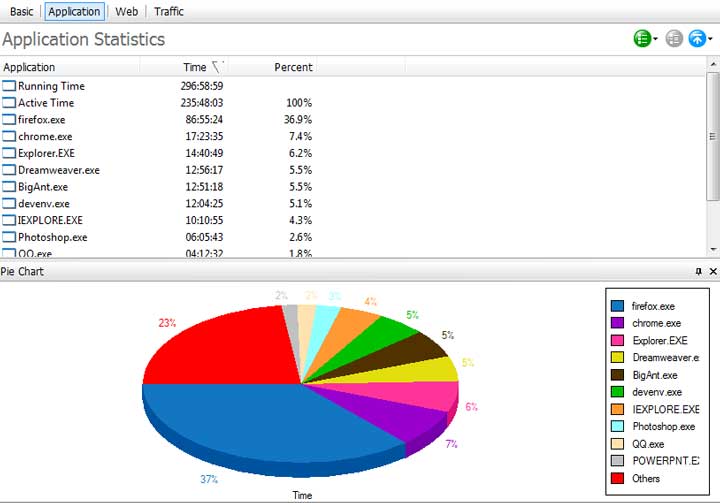
Application statistics by name will show you detailed application names. Using this, you can know the exact application names that your employees used and how much time they spent on it. Below is an example of top 10 applications.
Please note that this mode actually records application process names.
This mode is similar to Name mode. However, what it records is application description which may be different from application process name. For example, if two users are using QQ 2010 and QQ 2011, Application Statistics by Details will treat them as different applications while Application Statistics by Name will treat them as same application because the processes name are QQ.exe.
Using this mode, IT manager can easily find out the percentage of a certain computer or a group which uses the applications in a specific application class. Application Classes should be selected at first.
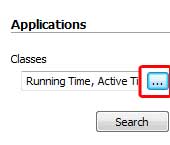
If you have sorted your applications into classes, you will see something like the picture below.
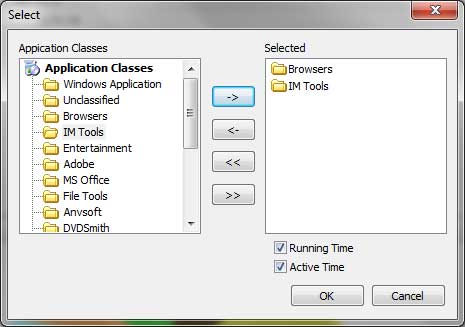
After Application classes are selected, click OK to apply. Then click Search button again to generate your desired application statistics.
| Auxiliary Functions | Back to Index | Web Statistics |